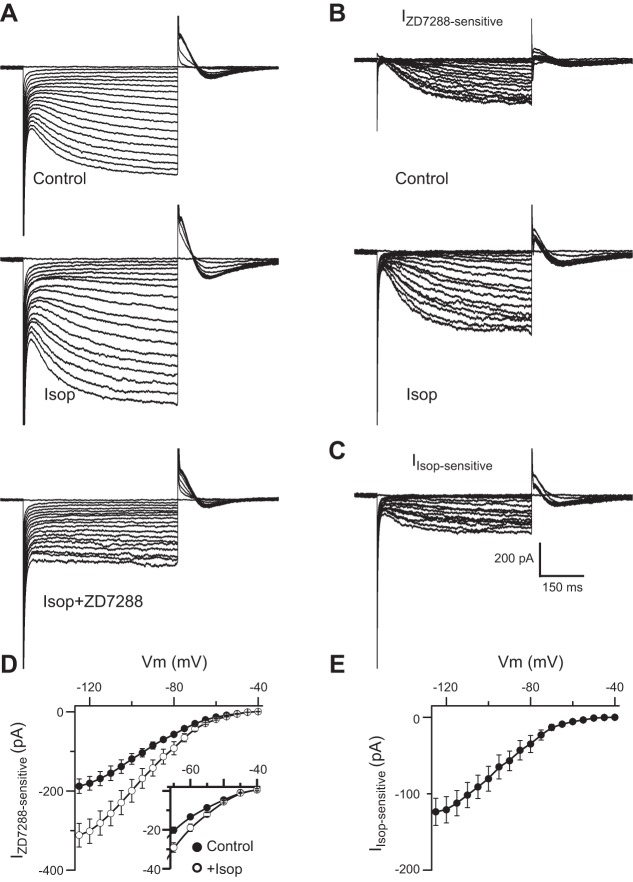
Fig. 3.
Isop augments Ih. A: example ET cell voltage-clamp traces show hyperpolarization-activated inward currents evoked by hyperpolarizing voltage steps (5-mV increment) from a holding potential of −40 mV to −125 mV in control, Isop (10 μM), and Isop+ZD7288 (100 μM). B: the ZD7288-sensitive current Ih in control and Isop obtained by subtraction analysis. Additional experiments (not shown) demonstrated that the I-V relationship in ZD7288 alone was identical to Isop+ZD7288 (P > 0.05, ANOVA, n = 4). C: the Isop-sensitive/enhanced Ih component obtained by subtracting current in control from that in the presence of Isop. D and E: group data (n = 5 cells) showing the I-V curves of ZD7288-sensitive Ih in control and Isop (D) and the net Isop-sensitive Ih (E). Inset in D shows enlarged y-axis scale to highlight differences in the ZD7288-sensitive Ih from −40 to −65 mV. Measurements of currents were obtained after steady-state conditions had been reached (480 ms after voltage step induction).

