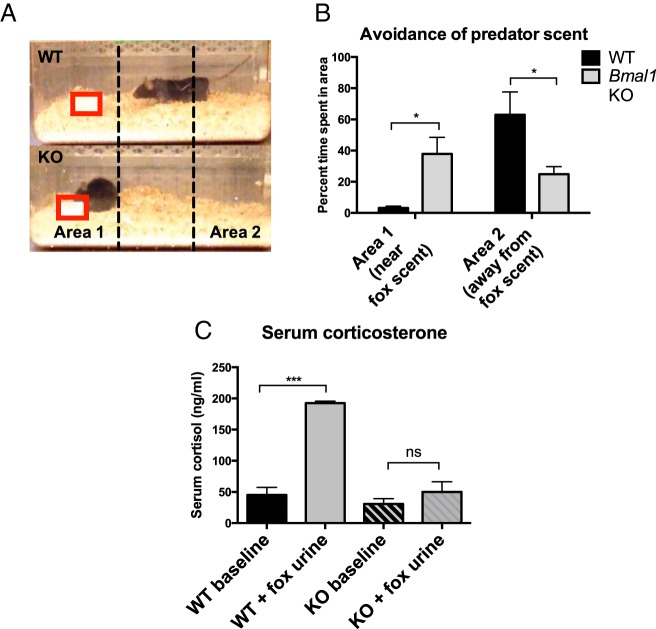
Figure 2.
Fear behavior in Bmal1 KO male mice. A and B, Fear behavior: time spent in marked area near (area 1) predator scent (fox urine) or away (area 2) from predator scent. Fox urine placement is marked by a red box (n = 6, one way ANOVA). C, Serum corticosterone was measured by an ELISA after exposure to predator scent for 10 minutes (n = 5 for scent exposed groups, n = 2 for baseline groups, one way ANOVA followed by Tukey post hoc). *, P < .05; **, P < .01; ***, P < .001.

