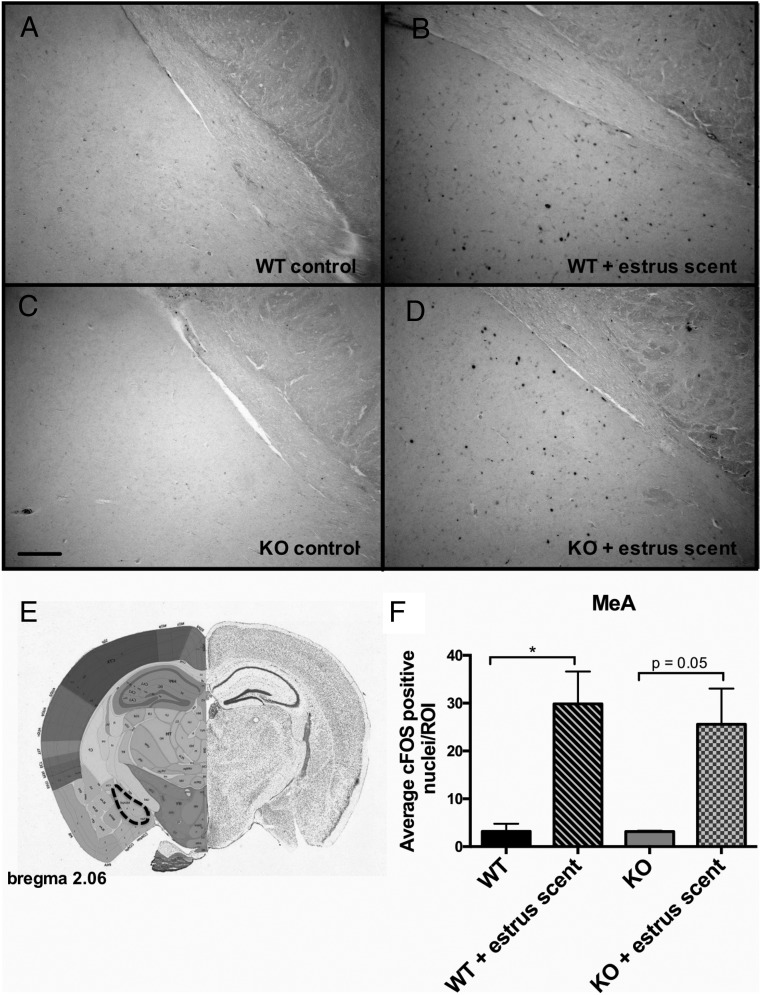
Figure 6.
Expression of c-FOS in the medial amygdala in WT vs Bmal1 KO males after exposure to estrous female scent. A, WT control. B, WT + estrous female scent. C, Bmal1 KO control. D, Bmal1 KO + estrous female scent. E, Dotted outline indicates quantified portion. Images were obtained from the Allen Mouse Brain Atlas (http://mouse.brain-map.org). F, Quantification of c-FOS-positive cells in defined area (n = 4 animals per treatment group). *, P < .5, **, P < .01, ***, P < .001, by ANOVA followed by Tukey post hoc. Scale bar, 100 μm. Image reproduced with permission from the Allen Institute.

