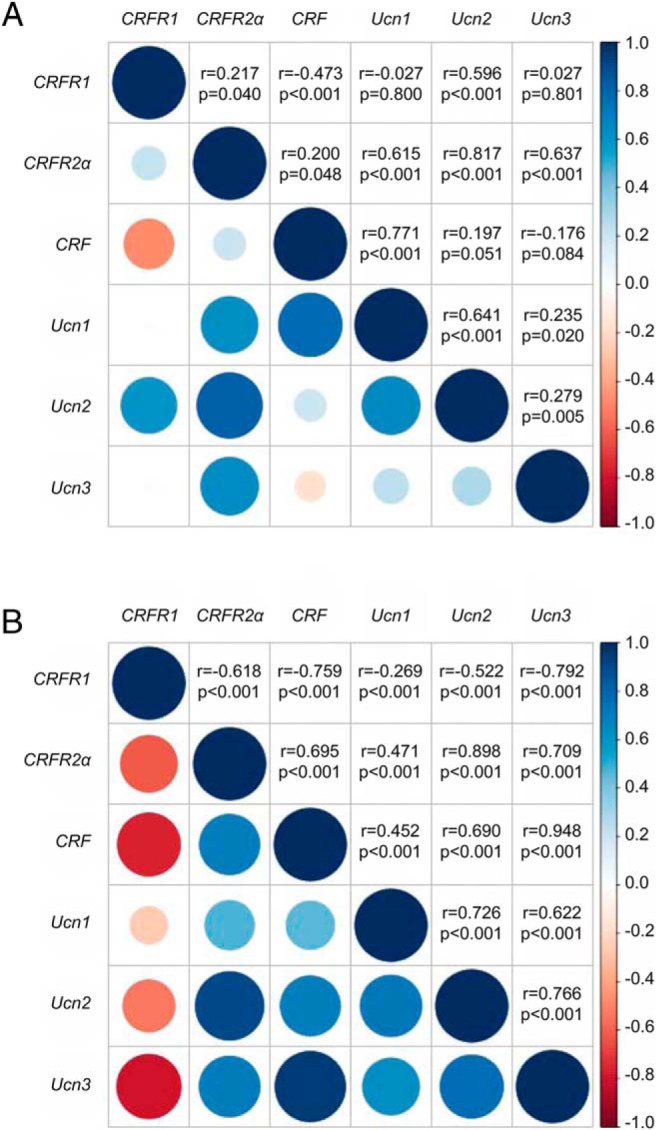
Figure 2.

Correlation matrix of gene expression levels of the CRF family of ligands and receptors in the LV of the human heart in heart donors (A) and heart failure patients (B). Gene expression levels were adjusted for age, gender, ethnicity, and sample storage time. The upper half of each figure displays the Pearson correlation coefficients and P value for each association. The lower half of each figure gives a pictorial representation of these values: the Pearson correlation coefficient is represented by the color of each circle (positive correlations are blue, negative correlations are red), whereas the P value is indicated by the size of the circle (larger circle sizes indicate highly statistically significant relationships).
