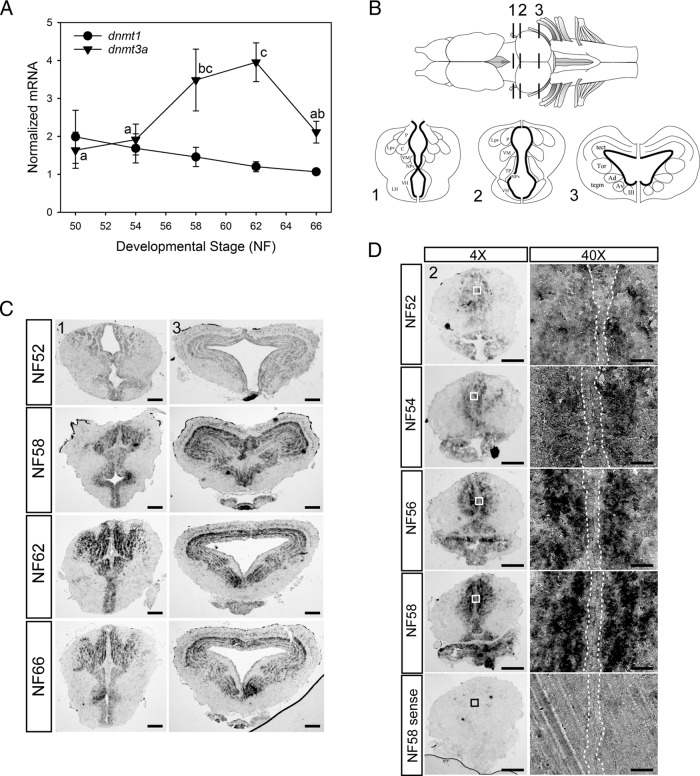
Figure 1.
Elevation of dnmt3a (but not dnmt1) mRNA levels, and localization of dnmt3a mRNA in Xenopus tadpole brain during metamorphosis. A, Changes in dnmt3a and dnmt1 mRNAs in X. laevis tadpole brain (middle brain region containing the preoptic area and diencephalon) analyzed by RTqPCR. We normalized dnmt3a and dnmt1 mRNAs to the reference gene α-actinin, which did not change across development. Points represent the means ± SEM (n = 5/developmental stage), and means for dnmt3a mRNA with the same letter are not significantly different (F(4,20) = 3.963; P = .017; ANOVA). The dnmt1 mRNA level was not significantly different across metamorphosis, so no statistical symbols are provided for this gene. B, Dorsal view of Xenopus brain (top) and three transverse sections (bottom) at the region of the ventral hypothalamus and thalamic nuclei (region 1) and the optic tectum and tegmentum (regions 2 and 3). The ventricular and subventricular zones are indicated by the bold lines on the transverse sections. P, posterior thalamic nucleus; C, central thalamic nucleus; Lpv, lateral thalamic nucleus, pars posteroventralis; VM, nucleus motorius nervi trigemini; NPv, nucleus of the paraventricular organ; VH, ventral hypothalamic nucleus; LH, lateral hypothalamus; tect, optic tectum; Tor, torus semicircularis; tegm, mesencephalic tegmentum; Ad, dorsal anterior thalamic nucleus; Av, ventral anterior thalamic nucleus; III, nucleus nervi oculomotorii; TP, posterior tuberculum. C, Distribution of dnmt3a mRNA in X. laevis tadpole brain during metamorphosis analyzed by ISHH. Shown are representative photomicrographs of transverse sections at the two brain regions shown in panel B. For region 1, scale bars = 160 μm for NF stages 52 and 59 and 200 μm for NF stages 62 and 66; for region 3, scale bars = 160 μm for NF stage 52 and 200 μm for NF stages 59, 62, and 66. D, The increase in dnmt3a mRNA in tadpole brain during metamorphosis occurs outside of neurogenic zones. We conducted ISHH for dnmt3a mRNA on X. laevis tadpole brain between premetamorphosis and late prometamorphosis. Shown are representative micrographs of transverse sections at the region of the ventral hypothalamus and thalamus (region 2 in panel B). Right panels show a magnified view (40×) of regions indicated by the boxes in the left panels. Areas within dotted lines indicate the VZ/SVZ. Note that dnmt3a mRNA is absent from the VZ/SVZ. Scale bars = 200 μm (4×) and 20 μm (40×). Hybridization with sense probe gave no signal at any developmental stage; only NF stage 58 is shown at the bottom of the figure.

