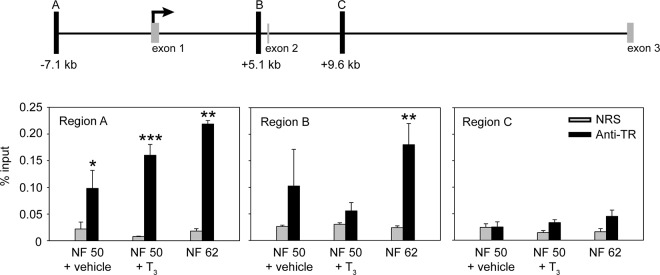
Figure 3.
Thyroid hormone receptors associate in chromatin with the dnmt3a locus in Xenopus tadpole brain. The schematic diagram (top) shows the location of the putative TR binding sites (black vertical bars; regions A, B, and C) identified by a ChIA-PET experiment conducted on X. tropicalis tail fin chromatin (L. M. Sachs and N. Buisine, unpublished data). Numbers below the bars indicate the distance from the TSS. The TSS was determined by an RNA-PET experiment (30), and the relative positions of the first two coding exons (CDS 1 and 2) are shown. We conducted targeted ChIP assays for TR (bottom) at regions A, B, and C using chromatin isolated from the brains of NF stages 50–52 X. laevis tadpoles treated with vehicle (0.0003% DMSO) or T3 (5 nm) for 48 hours, and chromatin from the brain of tadpoles at metamorphic climax (NF stage 62). Bars represent the mean ± SEM of the ChIP signal expressed as a percentage of input for anti-TR serum or NRS (negative control) (n = 4/group). Asterisks indicate statistically significant differences between the TR ChIP signal and NRS (*, P < .05; **, P < .01; ***, P < .001; Student's independent sample t test).

