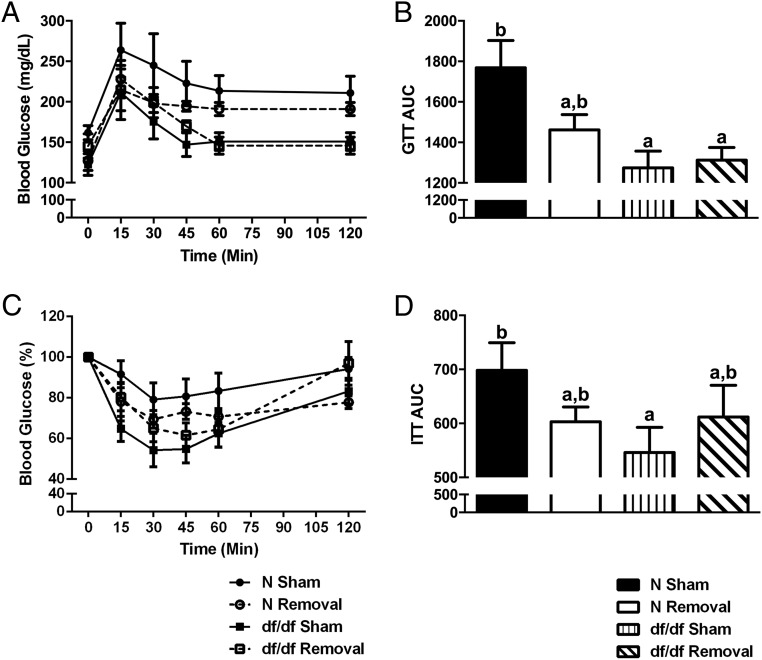
Figure 4.
BAT is not a key regulator of Ames dwarf glucose metabolism or insulin sensitivity. A and B, Glucose tolerance test (GTT) after iBAT removal. C and D, Insulin tolerance test (ITT) after iBAT removal (n = 7 per group throughout this figure). Values not marked with the same superscript letters (a–d) are significantly different (P < .05). df/df, homozygous; N, normal.

