
Figure 3.
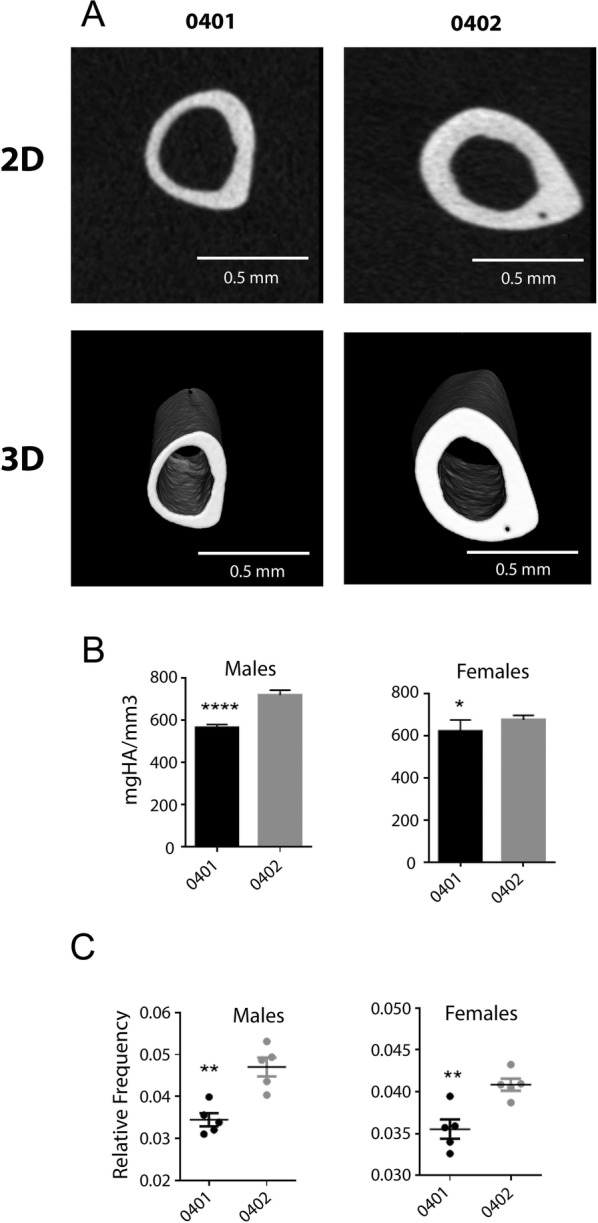
Tibial micro-CT analysis. (A) Representative 2D (upper panel) and 3D (lower panel) tibiae micro-CT images of SE-positive DRB1*04:01 (left column) and SE-negative DRB1*04:02 (right column) mice. (B) Tibial mineral density data of SE-positive DRB1*04:01 (black bars) and SE-negative DRB1*04:02 (gray bars) mice. (C) Male (left) and female (right) robustness data of the SE-positive DRB1*04:01 (black dots) and SE-negative DRB1*04:02 (gray dots) mouse groups. Values in (B) and (C) represent mean and SEM (n=5 per group). 2D, two-dimensional; 3D, three-dimensional; SE, shared epitope.