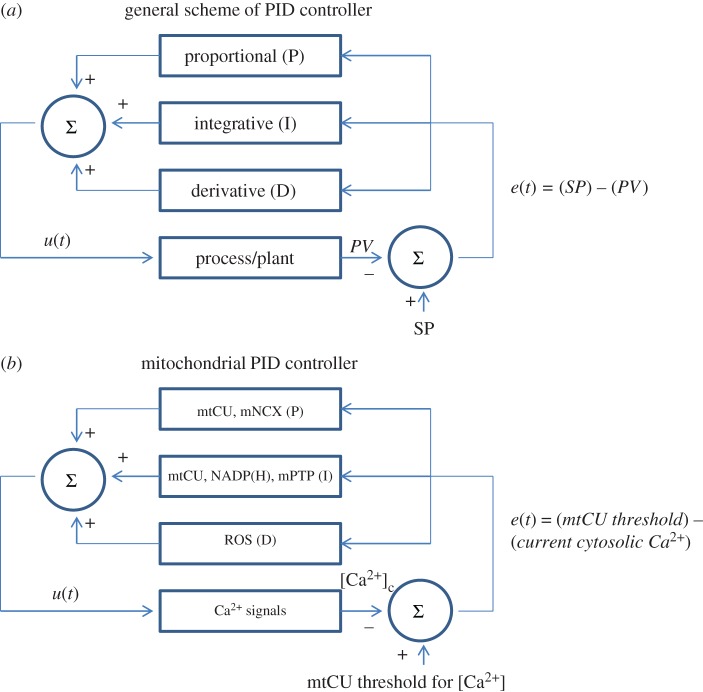
Figure 4.
Mitochondrial Ca2+ transport is analogous to a proportional–integral–derivative (PID) controller. (a) Block diagram of a PID controller, an engineering application that uses feedbacks to continuously generate an output signal in a dynamic system until it reaches a well-defined reference value. An error e(t) is generated continuously by comparing the SP with the current value of the parameter controlled by the system. Three elements within the PID controller produce three modes of output: proportional (P), integrative (I) and derivative (D) functions of e(t). The outcome of the three terms is then summed (∑) to give a system's output. (b) Mitochondrial Ca2+ transport as the PID controller for Ca2+ oscillations. Error signal (e(t)) represents the difference between mtCU threshold (SP) and current Ca2+ concentration (PV). Mitochondrial Ca2+ transport and associated metabolic processes display the same modes as those of the PID controller elements. Mitochondrial Ca2+ uptake (mtCU) and export (mNCX) mechanisms are proportional (P) to the Ca2+ loading of mitochondria, whereas mtCU, Ca2+-dependent NADP(H) response and the PTP in its low-conductance mode represent the I element. Finally, mitochondrial ROS production corresponds to the D element.

