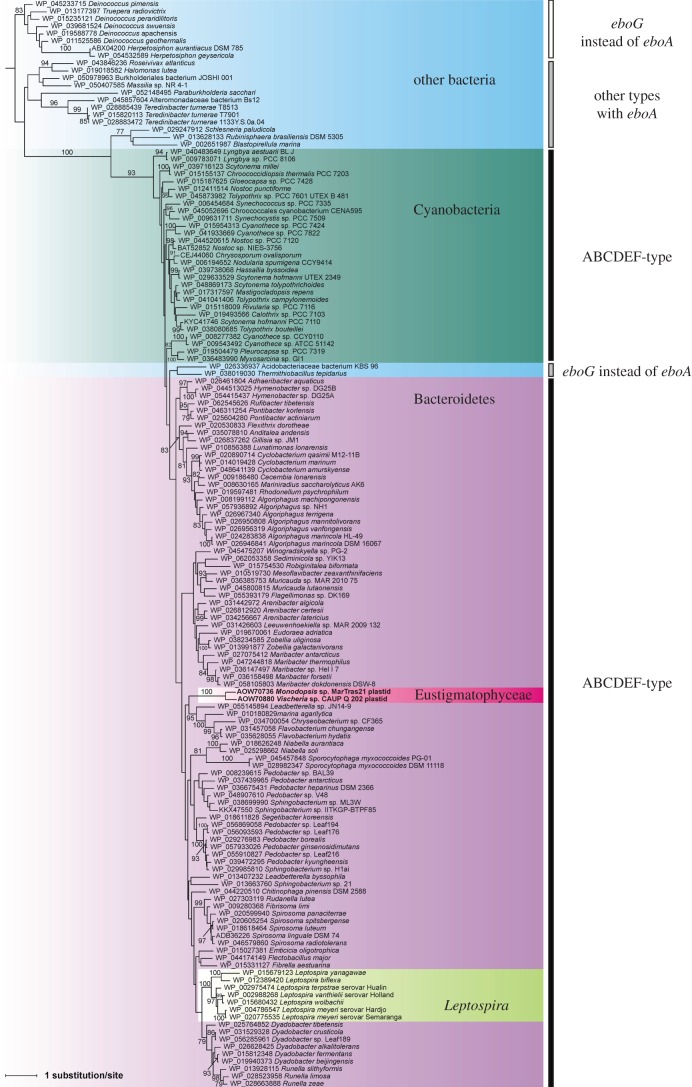
Figure 4.
Phylogenetic analysis of EboC protein sequences. The ML trees were inferred from an alignment of 224 amino acid positions using RAxML and the LG4X+Γ substitution model. Bootstrap support values are shown at branches when more than 75%. Five groups of species are distinguished by a different background: Bacteroidetes, violet; Cyanobacteria, blue-green; Eustigmatophyceae, red; Leptospira, light green; other bacteria, blue. Taxa are divided into three conveniently defined groups according to the type of ebo operon they possess (see the vertical bars on the right side). Note that some species assigned in the figure to the ABCDEF-type of the operon secondarily deviate from this presumed ancestral form for the given major taxa (see §3.2).

