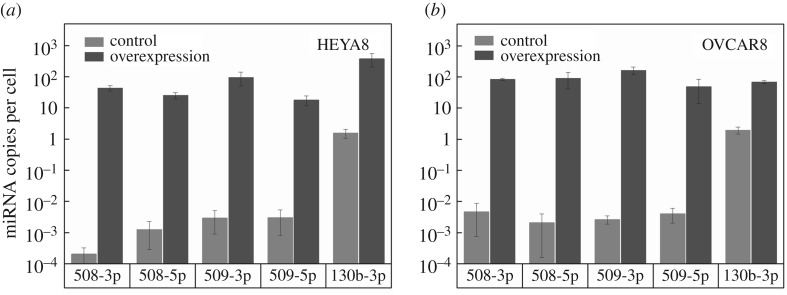
Figure 1.
Quantification of miR levels using droplet digital PCR. MiR copy number in negative control and miR-overexpressing samples 72 h after transfection with tumour-suppressor miRs. Data are shown for (a) HEYA8 and (b) OVCAR8 cells. The average numbers of miR copies per cell are calculated based on the quantity of RNA extracted from approximately 105 cells. Error bars show the standard deviation of N = 2 independent experiments.

