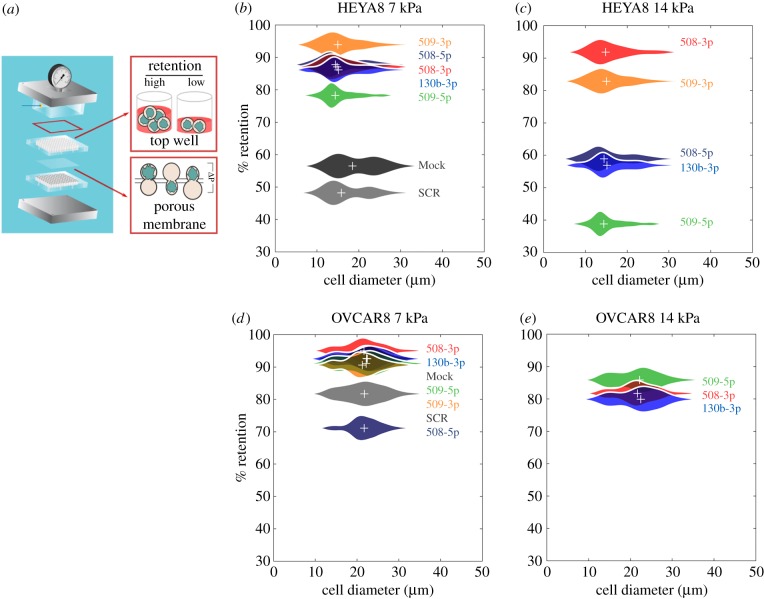
Figure 4.
Cells that overexpress tumour-suppressor miRs show decreased filtration through a porous membrane. (a) Schematic of the PMF set-up. Figure adapted from Qi et al. [27]. A cell suspension is driven to flow through a membrane with 10 µm pores by applying air pressure across the multiwell device; a larger number of occluded pores results in increased retention. Percentage retention as a function of the cell-to-pore size ratio, after 45 s of filtration of (b,c) HEYA8 and (d,e) OVCAR8 cells with applied pressures of (left) 7 kPa and (right) 14 kPa. Data are from N = 3 independent experiments. Violin plots show cell size distributions; crosses denotes the average retentions and median cell sizes.

