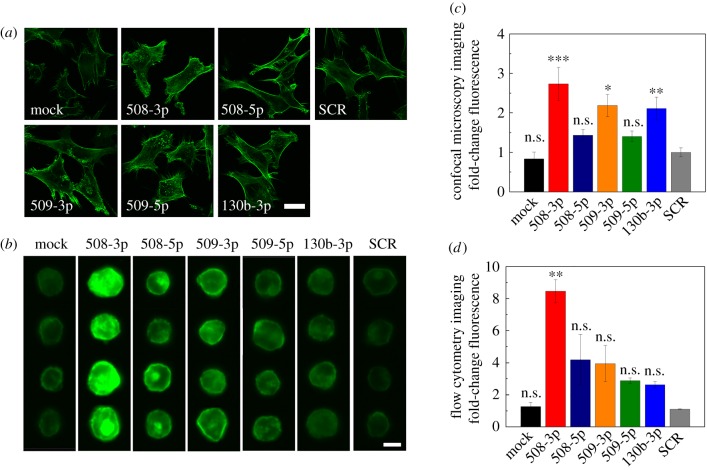
Figure 7.
Subcellular structure with elevated levels of tumour-suppressor miRs. (a) Confocal microscopy images of HEYA8 cells attached to collagen-coated glass slides. Scale bar, 20 µm. (b) Representative images of HEYA8 cells in suspension obtained by flow cytometry imaging. Scale bar, 10 µm. (c) Measurements of the integrated fluorescence intensity of single cells in the adhered state. At least 24 cells are analysed for each sample over N = 3 independent experiments. (d) Quantification of the relative fluorescence intensity of F-actin per single cell based on flow cytometry imaging. At least 3991 cells are analysed for each sample over N = 3 independent experiments. One-way ANOVA with a Tukey post hoc test; ***p < 0.001, **p < 0.01, n.s., p > 0.05, compared to the scrambled control treatment (SCR). Error bars show standard error of the mean.

