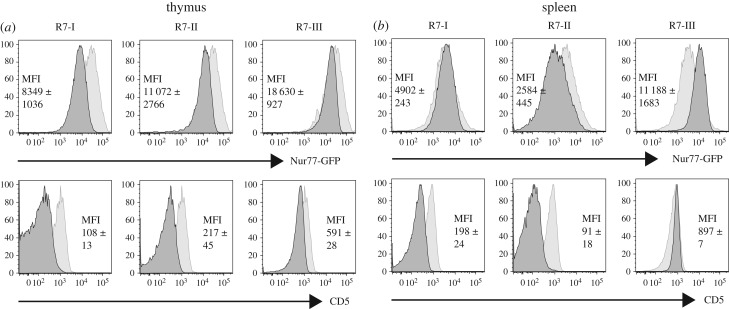
Figure 7.
Relative self-reactivity of Rop7-I, -II and -III CD8 T cells. Rop7-I, -II and -III mice were crossed to Nur77-GFP transgenic mice. (a) Histograms show (i) GFP or (ii) CD5 levels on CD8SP H-2 Ld-Rop7+ T cells (dark grey histograms) from mice heterozygote for TCRα and β compared to CD8SP cells from a control Nur77-GFP transgenic mouse (light grey histograms). MFI +/− standard deviation of two independent values. Representative of at least five mice per genotype. (b) Histograms show (i) GFP or (ii) CD5 level on CD8+ tetramer+ Rop7 T cells (dark grey histograms) compared to CD8+ cells from a control Nur77-GFP transgenic mouse (light grey histograms).

