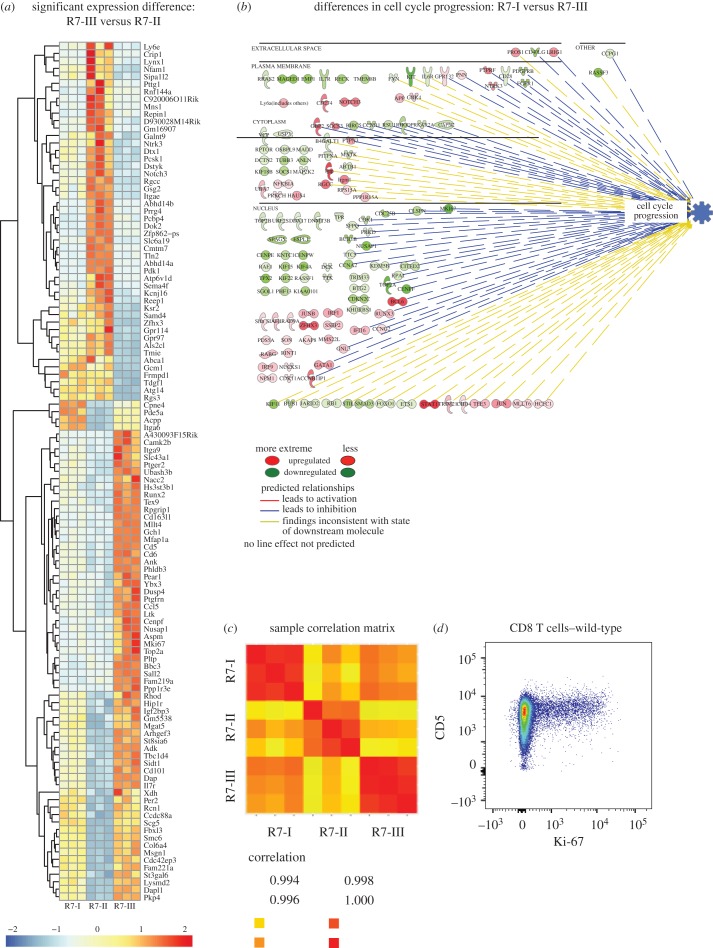
Figure 8.
Transcriptional profile of non-activated R7-I, R7-II and R7-III CD8 T cells. (a) Row centred heatmap of transcripts per million (TPM) values for genes with a significant expression difference of over twofold between R7-III and R7-II homozygous CD8 T cells. (b) Ingenuity pathway of genes associated with cell cycle progression and found to be significantly differentially expressed between R7-I and R7-III homozygous CD8 T cells. (c) Sample correlation matrix for R7-I, R7-II and R7-III CD8 T cells generated from TPM values for expressed genes (assumed to have a minimum TPM of 1 across all samples in the experiment). Each row and column represents a replicate biological sample of the denoted Rop7 clones. (d) CD5 versus Ki-67 expression gated on CD8 T cells from WT BALB/c mice.

