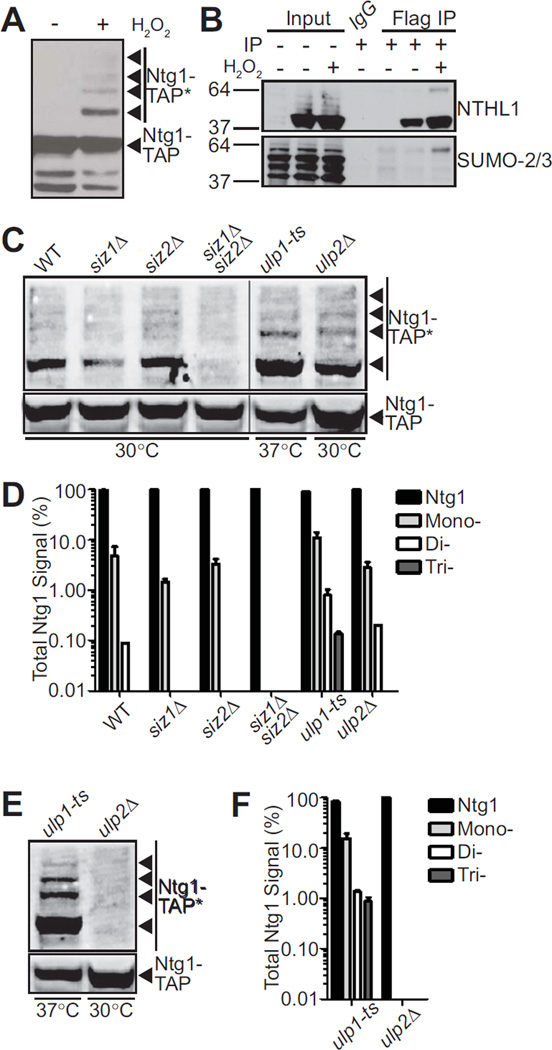
Figure 1. Sumoylation of Ntg1 is conserved and mediated by Siz1/2.
A. Wildtype S. cerevisiae cells expressing Ntg1-TAP were exposed to 0 (−) or 20 mM (+) H2O2 for 1 hour at 30°C. Cells were pelleted, lysed, and immunoblotted to detect TAP-tagged Ntg1. Bands corresponding to post-translationally modified Ntg1 including SUMO-modified Ntg1 (24) are indicated by Ntg1-TAP*. B. Colon adenocarcinoma cells (HT29) were transfected with NTHL1-Flag or empty Flag vector and treated with 0 (−) or 125 µM (+) H2O2 for 15 minutes at 37°C. Cells were lysed, immunoprecipitated with Flag antibodies and both the Input and Flag IP fractions were subjected to immunoblotting. An IgG bead alone immunoprecipitation was included as a control. The blot was probed with NTHL1 and SUMO-2/3 antibodies as indicated. C. Wildtype (WT), siz1Δ, siz2Δ, siz1Δsiz2Δ, ulp1-ts, or ulp2Δ cells were transformed with a plasmid expressing Ntg1-TAP. Cells were (C) exposed to 20 mM hydrogen peroxide or (E) not treated. Cells were incubated at 30°C except ulp1-ts cells which were shifted to the non-permissive temperature of 37°C. Each sample was lysed, immunoblotted, and bands were quantified. Nonadjacent lanes in the same image are separated by a black line. D. The data from (C) were quantitated. The total amount of Ntg1-TAP including unmodified and modified Ntg1-TAP was set to 100% (Ntg1) and the fraction of signal present in bands (Total Ntg1 Signal %) corresponding to the size consistent with Mono-, Di-, and Tri-sumoylation is plotted on a log scale. Results shown are the average of two independent experiments. Error bars represent SEM. E. To examine sumoylation of Ntg1 in the absence of oxidative damage, ulp1-ts and ulp2Δ cells expressing Ntg1-TAP were analyzed to detect any modified Ntg1 species (Ntg1-TAP*). F. The data from (E) were quantitated. The total amount of Ntg1-TAP including unmodified and modified Ntg1-TAP was set to 100% (Ntg1) and the fraction of signal present in bands (Total Ntg1 Signal %) corresponding to the size consistent with Mono-, Di-, and Tri-sumoylation is plotted on a log scale. Results shown are the average of two independent experiments. Error bars represent SEM.

