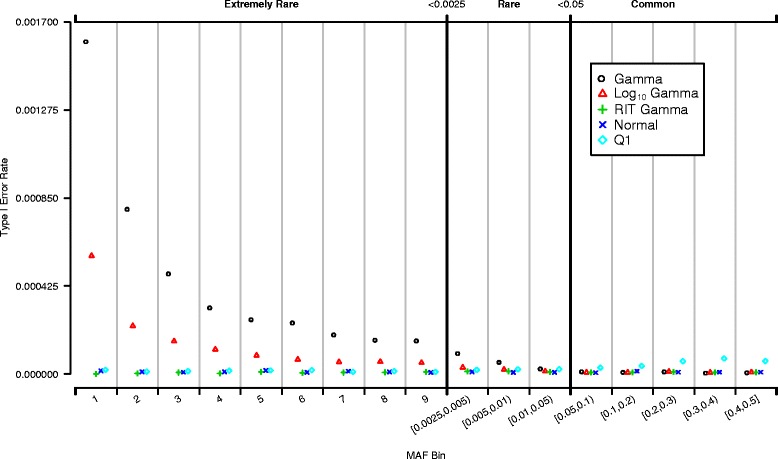
Fig. 2.

Distribution of type I error rate by MAF. Type I error rate versus MAF. Different color/symbols indicate different null traits. Each point indicates average type I error rate at the critical level of 10-5 of SNVs grouped by MAF; extremely rare variants (MAF < 0.0025) are classified by number of occurrences of the rare allele, while rare (0.0025 ≤ MAF < 0.05) and common (MAF ≥ 0.05) ones are classified by MAF range
