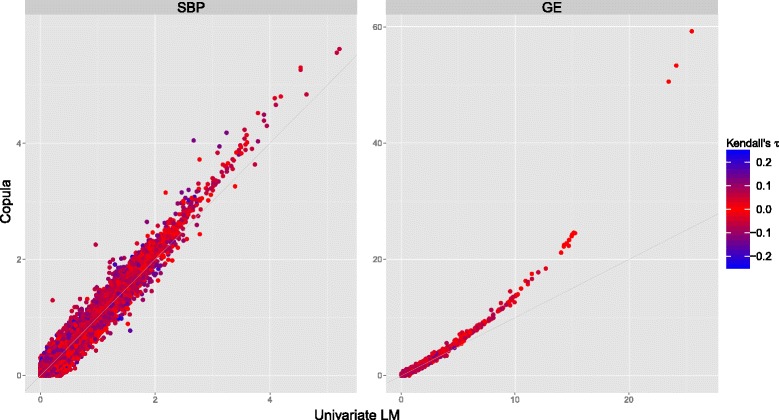
Fig. 2.

Scatterplots of the p values (on a − log10 scale) of all tested common and rare SNVs for testing H 0 : α 1 = 0 (for SBP, left panel) and H 0 : β 1 = 0 (for GE, right panel) under the copula model versus the univariate model. For each SNV, the strength of the association (Kendall’s τ) between the corresponding GE and SBP is shown by the color of the dots
