Fig. 2.

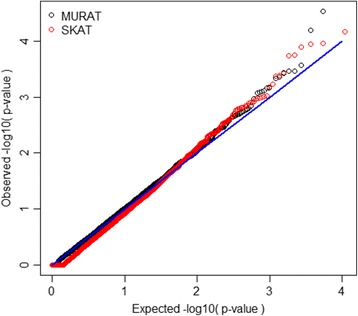
Quantile–quantile (Q-Q) plot for p values obtained by using MURAT and adjusted p values obtained by using SKAT to test 10,866 genes. The adjusted p values are defined as twice the minimum of the SBP and DBP-based p values obtained via SKAT

Quantile–quantile (Q-Q) plot for p values obtained by using MURAT and adjusted p values obtained by using SKAT to test 10,866 genes. The adjusted p values are defined as twice the minimum of the SBP and DBP-based p values obtained via SKAT