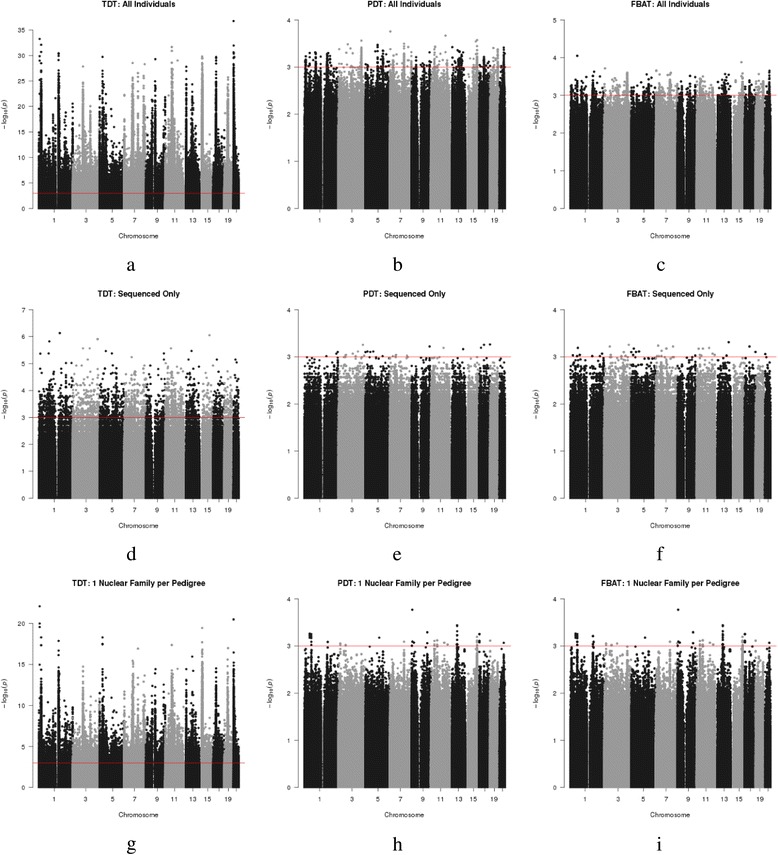
Fig. 1.

Manhattan plots for TDT (a, d, g), PDT (b, e, h) and FBAT (c, f, i) for all data (a, b, c), the sequenced subset (d, e, f), and the nuclear subset (g, h, i). Everyone has been coded as “affected” because we are evaluating evidence for general population TRD. A threshold line was set at 10−3 for comparability with the regression analysis. The effect of imputation on the test statistic can be seen by comparing across rows, while the impact of the different test statistics can be compared across columns. The y-axis varies across the plots
