Fig. 2.

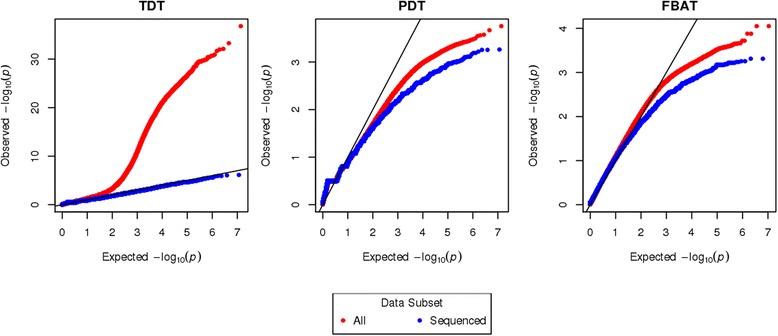
Q-Q plots of TDT, PDT, and FBAT p values for all (red) and sequenced (blue) subsets of the data. Both axes are plotted on the - log10 scale. The y-axis varies across the plots

Q-Q plots of TDT, PDT, and FBAT p values for all (red) and sequenced (blue) subsets of the data. Both axes are plotted on the - log10 scale. The y-axis varies across the plots