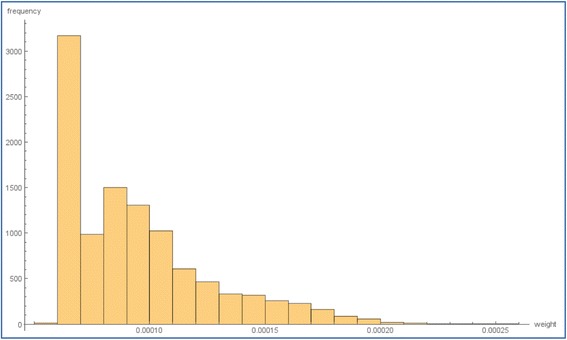
Fig. 2.

Frequency distribution of the weights used for variants in the weighted covariance kernel. Each weight represents the relative proportion of the functional potential − loglikelihood estimation of each variant in the kernel. The large proportion of variants in the first bin have a very small weight, and correspond to variants with a low confidence of having an allele-specific chromatin accessibility effect
