
Fig. 4.
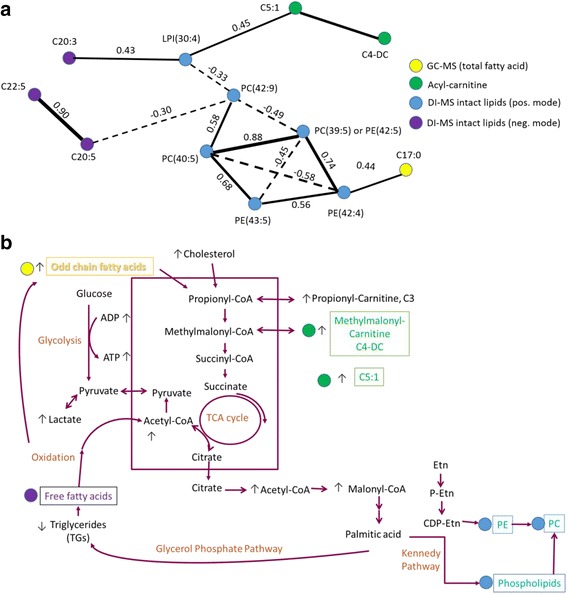
Network of selected metabolites. a A partial correlation network of the most discriminatory metabolites (12) differentiating between different doses of the PPAR-pan treatment concentrations. The solid lines denote positive and dotted lines denote negative correlations, and the thickness of the lines indicate the strength of the associations. b Biological pathways and their potential connections associated with the selected 12 metabolites. Note that metabolites of interest that were detected by our RF approach are color-coded on both pathway maps