Fig. 5.

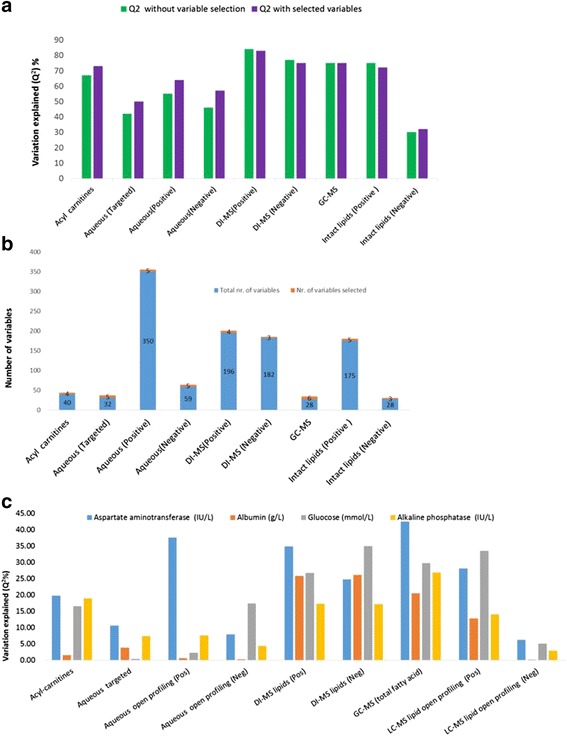
Variations explained by metabolomic and lipidomic datasets in relative liver weight and clinical chemistry parameters using the random forest (RF) regression approach. a Variation explained (Q2) in relative liver weight with and without variable selection. b The number of selected variables compared to the original (full dataset) number of variables. c Variation explained (Q2) with all the metabolomic and lipidomic data linking with phenotypes associated with plasma clinical chemistry from liver analysis. In total four parameters showed the largest variation explained across the different data sets
