
Fig. 6.
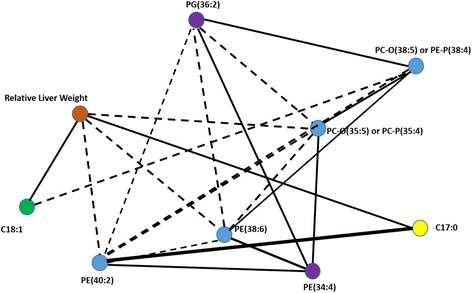
A partial correlation network of the nine selected variables linking with the relative liver weight (ratio between the measured body weight and the measured liver weight of each animal). Different types of data are shown in different colours. The thickness of the lines relate to the extent of the correlation, where straight lines indicate positive and dotted lines indicate negative correlations