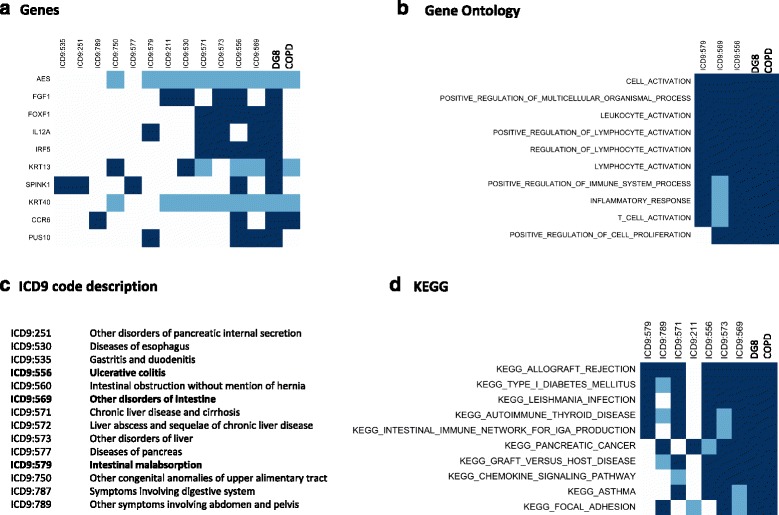
Fig. 5.

Genes and Pathways relating COPD and Digestive Alterations Disease Group (DG8). The figure shows the association between genes (a), Gene Ontology (b) and KEGG (d) gene-sets for those ICD9 codes included in DG8; the description of ICD9 codes is provided in panel (c). A dark (light) blue square denotes if the association between disease and pathway or gene was computed as significant when using either mapping1_DG or mapping2_DG (only mapping1_DG). Top 10 genes or gene-sets are shown; and then only ICD9 codes with at least association with an item are shown. The ICD9 codes are ordered using the number of associations with genes or gene-sets in the total set; from lower (left) to higher (right). The last two elements denote the association with DG8 and COPD. Similar information for Biocarta and Reactome is depicted in Additional file 12: Figure S8. In panel (c), those ICD9 codes shown in all other panels are in bold
