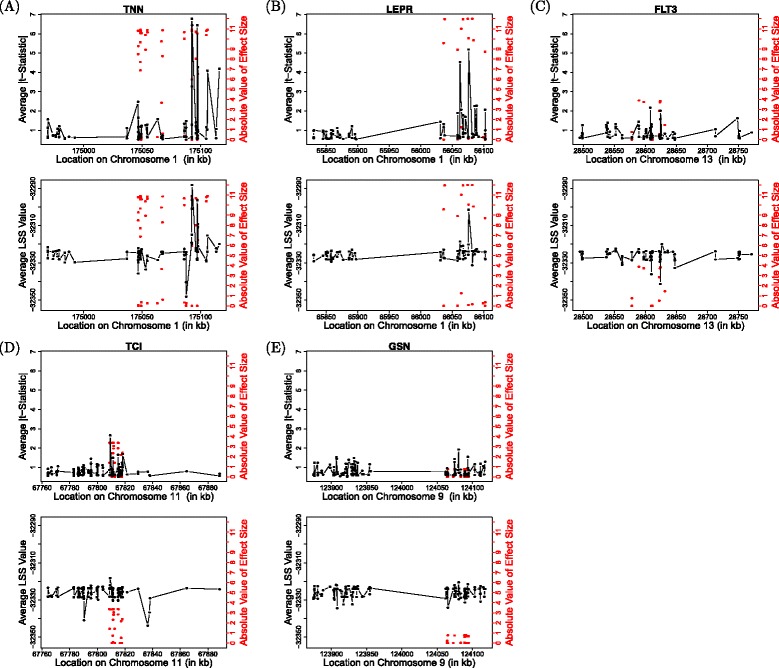
Fig. 2.

Example plot of each test statistic across the genes analyzed. Each upper plot in panels a to e shows the absolute value of the t-statistic against the location of each SNP along the chromosome. Each lower plot shows the average LSS value plotted against the base pair location of each SNP. Each red dot shows the true absolute value of the effect size at that respective locus. Both the t-test and LSS show similar precision in localizing the true absolute effects
