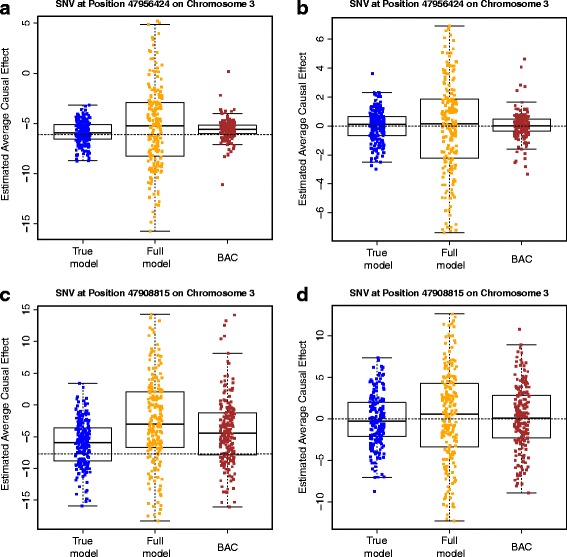
Fig. 1.

ACE estimates. ACE estimates based on the “true model,” the “full model” and BAC for two MAP4 SNVs at position 47956424 (a and b) and position 47908815 (c and d) on chromosome 3. a and c are based on 200 simulated phenotypic data sets; b and d are based on 200 Q1 data sets. The dashed line indicates the true ACE
