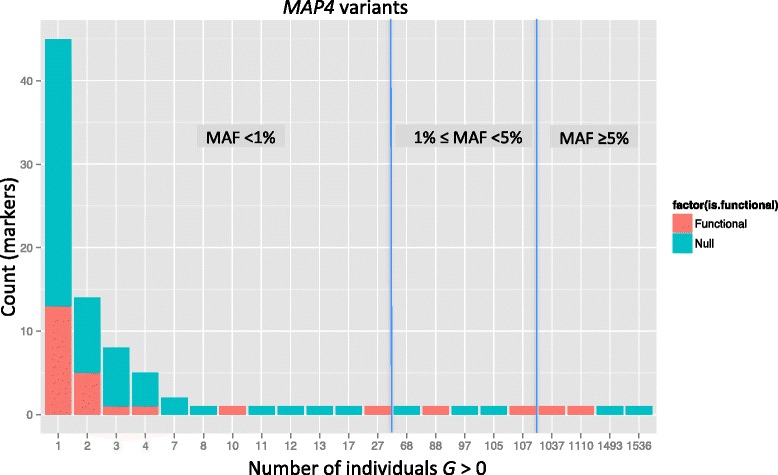
Fig. 2.

Distribution of the frequency for the 90 polymorphic MAP4 variants according to the number of individuals with genotype dosage G > 0. Height of the bars indicates the total number of variants for a given count of observations with G > 0, and red bars indicate the counts for the 26 functional variants used in the simulation model
