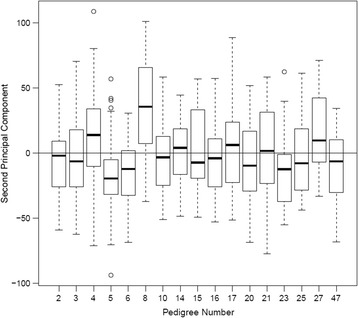
Fig. 3.

Box-and-whisker plots of the second PC for each of the individuals from the 17 pedigrees. The edges of the boxes are the upper and lower quartiles and the whiskers extend to the most extreme points within 1.5 times the interquartile range of the closest quartile. Points outside these limits are plotted individually. The location of the median in each pedigree is indicated as the thick line across the box. The horizontal line across all boxes is at 0, the overall mean of the PC
