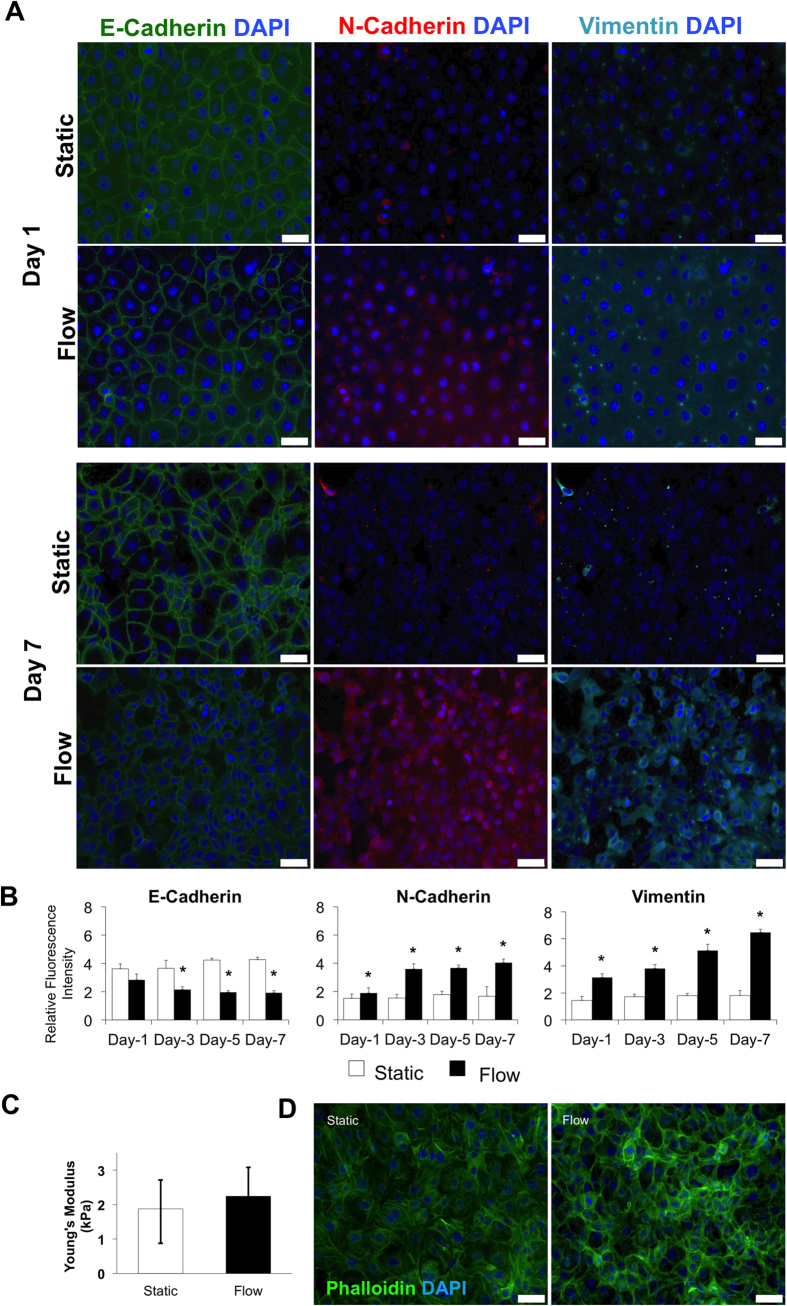
Figure 2. Comparative analysis of epithelial and mesenchymal markers expressions.
(A) Fluorescence immunocytochemistry staining for E-cadherin (green), N-cadherin (red) and vimentin (cyan) was performed on esophageal cancer cells under static and microfluidic flow conditions at different time points. (B) Bar graphs demonstrating the intensity of expressed E-cadherin, N-cadherin and vimentin under flow and static conditions on days 1, 3, 5, 7. Quantification of fluorsence intensities from arbitrary images of each condition was done with ImageJ software (NIH, Bethesda, MD, USA). The intensities were calculated as mean ± SE (n ≥ 5), star (*) indicates p < 0.05. Immunocytochemical analysis showed that fluid flow caused 21.6% decrease in E-cadherin expression at day 1 and 54.8% decrease at day 7 compared to the static control conditions (Fig. 2A,B). In parallel, we observed flow mediated 1.24-times increase in N-cadherin expression at day 1 and 2.41-times increase at day 7 compared to control conditions (Fig. 2A,B). Furthermore, we confirmed the gain of mesenchymal features under fluidic flow induced shear stress by detection of the intracellular expression of vimentin. At day 1, vimentin expression under flow conditions was 2.15-times higher than the static controls and this increase continued to a 3.54-times at day 7 (Fig. 2A,B). To define the changes in experimental groups, the ratio of flow and static mean fluorescence intensity values of static samples were used. (C) Atomic force microscopy (AFM) was used to measure the cell stiffness. Bar graphs demonstrating the Young’s Modulus of cells under static control and flow conditions. (D) Esophageal cancer cells were stained with Phalloidin to visualize the actin microfilaments, and with 4′, 6-diamidino-2-phenylindole (DAPI) to visualize nuclei under static and laminar microfluidic flow conditions. (Scale bars: A and C, 50 μm). All data were expressed as mean ± S.E.M., n = 3, star (*) indicates, p < 0.05.

