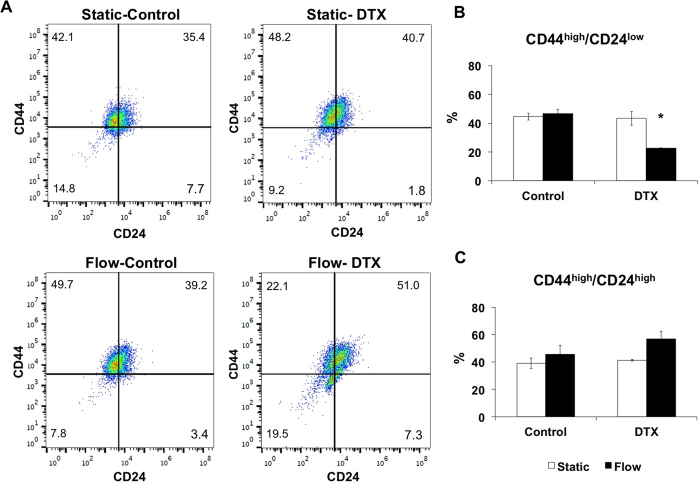
Figure 4.
(A) Representative plots showing the distribution of CD44high/CD24low and CD44high/CD24high cells for control and docetaxel (3 nM) groups under static and laminar microfluidic continuous flow. (B) Bar graphs demonstrating the percentages of CD44high/CD24low cells in static and laminar microfluidic flow conditions w/and w/o docetaxel. (C) Bar graphs demonstrating the percentages of CD44high/CD24high cells in static and laminar microfluidic flow conditions w/and w/o docetaxel. All data were expressed as mean ± S.E.M., n = 3, star (*) indicates, p < 0.05.

