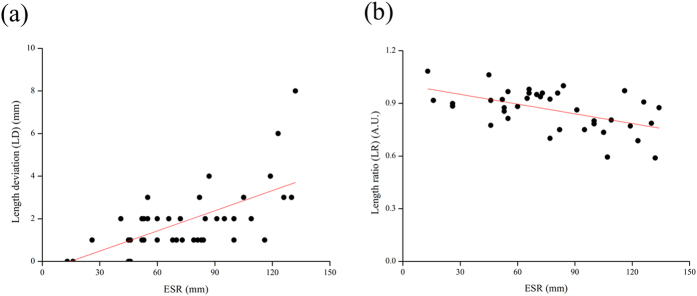
Figure 5. The results of paper-based device analysis of ESR showing LD and LR in diluted blood.
We obtained sensitivity using a linear equation to generate an Orginpro 8.5 curve fitting. This figure shows the calibration plot for the length ratio of the results for the reagent compound (latex) reaction in our paper-based device compared to medical mainframe examinations of ESR and CRP data. (a) Patient samples indicating osteomyelitis inflammation by LD. (b) Patient samples indicating osteomyelitis inflammation by LR. The curve fitting to the data using the equation displays R-Square LD: 0.301 LR: 0.264, Pearson’s r LD: 0.563 LR: 0.533 and Residual Sum of Squares LD: 32109.263 LR: 0.351.

