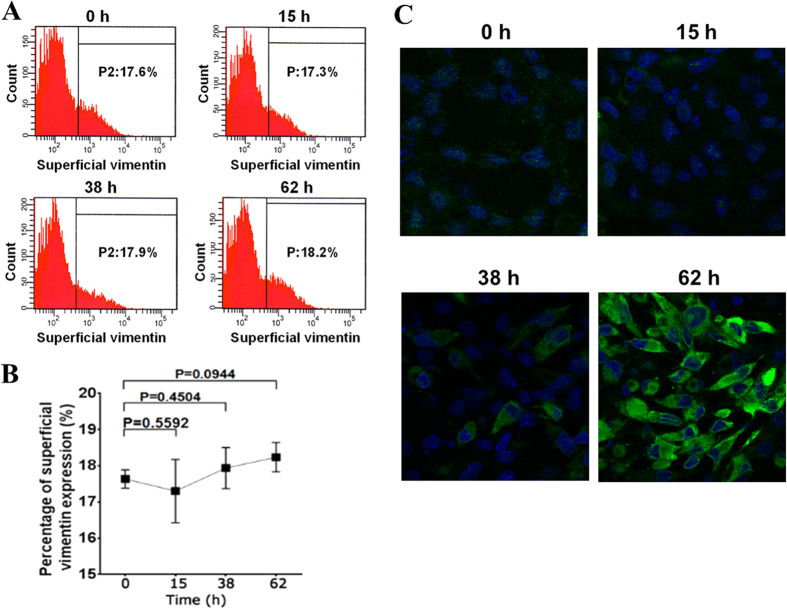
Figure 3. Expression level of superficial vimentin unaffected by DENV-2 infection.
(A) Flow cytometric analysis of superficial vimentin on DENV2-infected ECV304 cells at 15, 38, and 62 h post-infection (hpi), and 0 h infected cells were used as control. (B) Quantitative analysis of superficial vimentin on DENV2-infected ECV304 cells at the indicated time points. Data are presented as means ± standard deviation (S.D.) (n = 3). P-values were indicated versus 0 h infection. (C) IFA of DENV-2 infected ECV304 cells at the indicated time points. The DENV-2 infected ECV304 cells were detected with the mouse anti-DENV-2 EDIII pcAb, and cell nuclei were stained by DAPI as described in Materials and Methods. After washing, the cells were observed under a confocal laser microscope (magnification, ×400).

