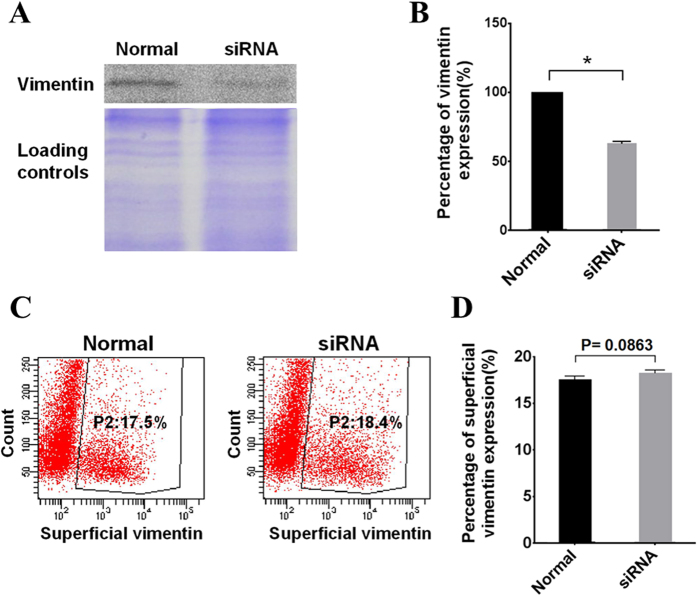
Figure 4. Expression level of the superficial vimentin unaffected by siRNA interference.
(A) Western blot analysis shows the knockdown efficiency of total vimentin in transfected ECV304 cells with siRNA targeting vimentin compared with untransfected normal cells. Equal loading of the gels was confirmed by staining the gel with Coomassie brilliant blue G-250. The full-length blots/gels are presented in Supplementary Figure 2. (B) The protein gray value was relative to protein expression level. The total vimentin protein gray values of normal ECV304 cells and siRNA transfected cells were analyzed by Image-Pro Plus 6.0 software. The percentage of vimentin expression after siRNA interference was plotted in comparison with that in normal cells, which was set to 100%. The * indicates P < 0.01. (C) ECV304 cells were transfected with vimentin siRNA; after 48 h, the cell superficial vimentin was tested by flow cytometric analysis. Untransfected normal cells were used as negative control. (D) Quantitative data of flow cytometric analysis are presented as means ± S.D. (n = 3), and the P-value was indicated.

