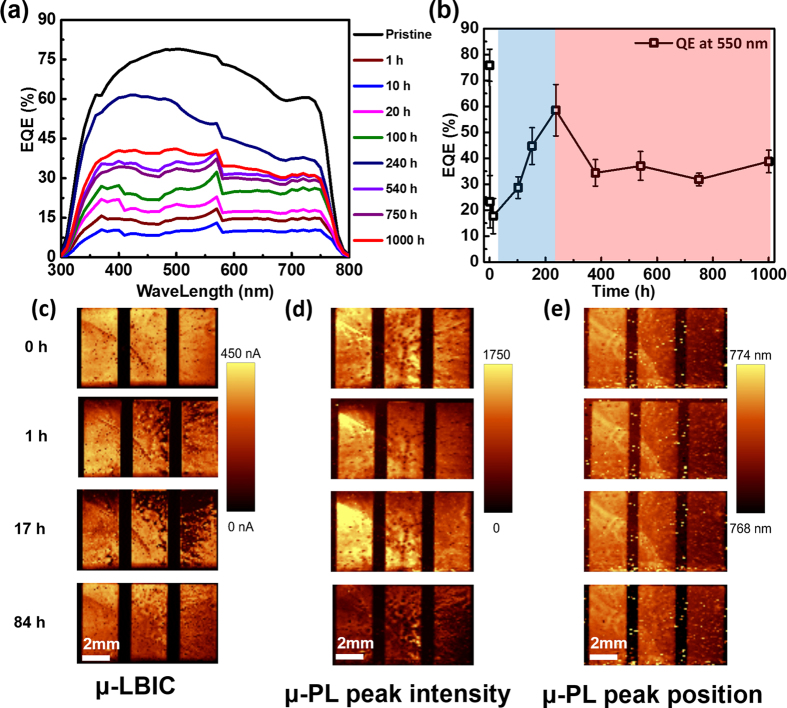
Figure 4.
(a) EQE at 300–800 nm, and (b) at 550 nm for devices subjected to UV exposure for times in the range 0–1,000 h. Results are an average of data for six samples. Spatially resolved results: (c) μ-LBIC, (d) μ-PL peak intensity in arbitrary units, and (e) peak position in nm. Three single cells, which are located on one glass substrate, are depicted (ea. 0.125 cm2). The cells were illuminated from the glass side using a 640 nm laser.

