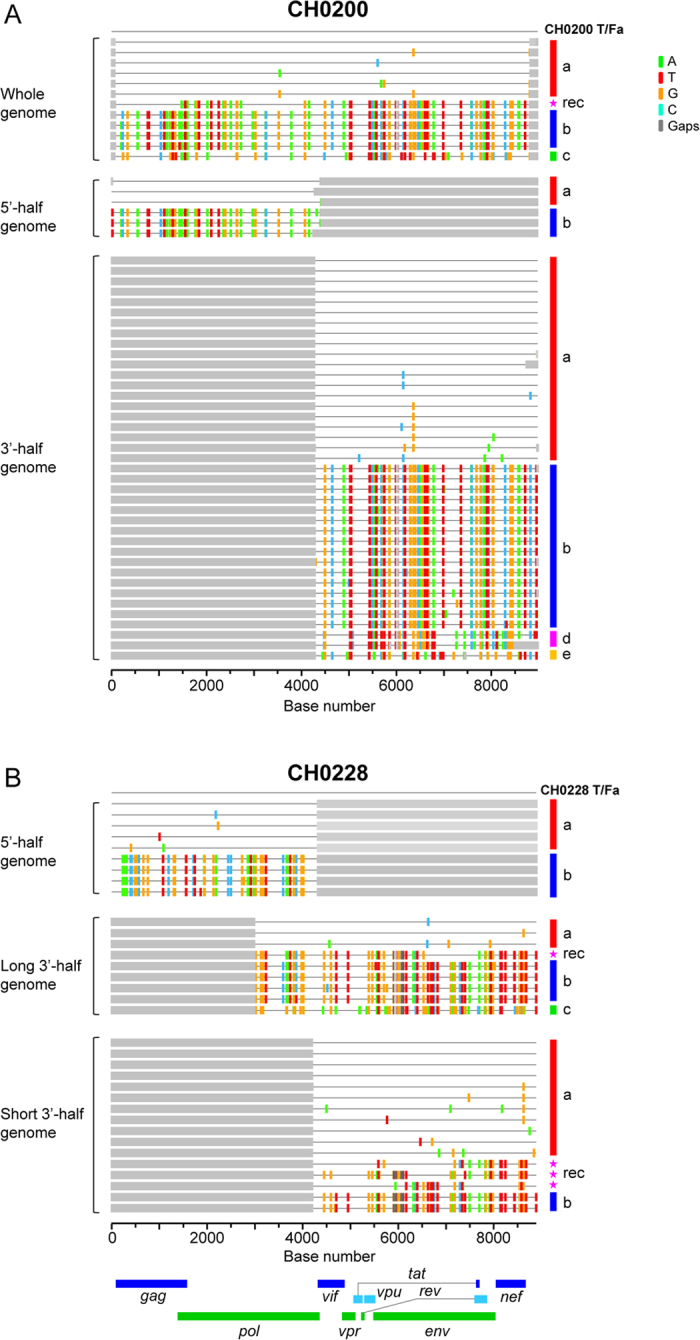
Figure 4. Identification of matching 5′- and 3′- half genomes from the same T/F virus in each individual.

Highlighter plots identified the matching 5′- and 3′- half genomes from the same T/F virus by using NFLG genome sequences in CH0200 (A) and long overlapping sequences (~1000 bp) in CH0228 (B). The T/Fa and T/Fb sequences that were identical or highly similar in NFLG and both half genome sequences (CH0200) or in the overlapping region in the middle of HIV-1 genomes (CH0228) are indicated by red and blue bars, respectively.
