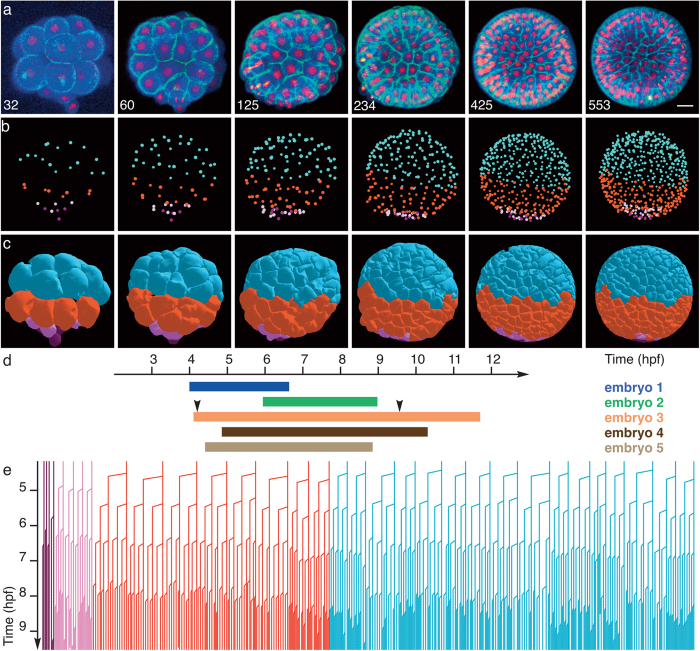
Figure 2. Reconstruction of digital sea urchins from 3D+ time in vivo and in toto imaging.
(a to c) Raw and reconstructed data from one specimen (embryo 3) at different stages of development. Scale bar 20 μm. (a) Volume rendering of raw images (Amira software) from two-photon laser scanning microscopy. Total cell number indicated bottom left. (b,c) Reconstructed digital embryo, displayed with Mov-IT software. (b) Detected nuclear centres with colour code for cell types propagated along the lineage: mesomeres (Mes) in blue, macromeres (Mac) in red, large micromeres (LMic) in pink, and small micromeres (SMic) in purple. (c) Surface rendering of segmented cell membranes, colour code as in (b). (d) Temporal observation window for each specimen of the cohort, time scale in hours post-fertilisation (hpf) after temporal rescaling (details in Supplementary Fig. 2). Arrowheads for embryo 3 indicate the temporal window displayed in (e). (e) Flat representation of the reconstructed cell lineage of embryo 3 with the same cell type colour code as in (b), time scale in hpf.

