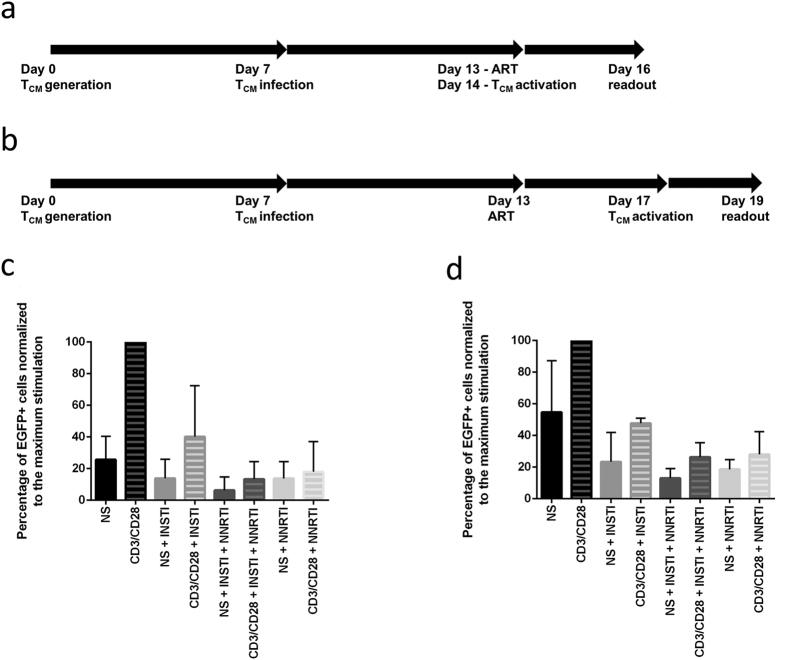
Figure 1.
Schematic representation of the modified short (a) and original long (b) model workflows and corresponding average EGFP expression in the short (c) model depicted in 1a and in the long (d) model depicted in (b). (a and b) legend: TCM–central memory T cells. (c and d) legend: NS–cells not stimulated (full bars). CD3/CD28–cells activated with αCD3/CD28 microbeads (striped bars), INSTI–integrase strand transfer inhibitors treatment. NNRTI–non-nucleoside reverse transcriptase inhibitor treatment. (c) Error bars represent the standard deviation (SD) of 7 replicate experiments performed on cells from 7 independent donors. (d) Error bars represent the standard deviation of 3 replicate experiments performed on cells from 3 independent donors. The data was normalized to maximum stimulation by CD3/CD28 per experiment.

