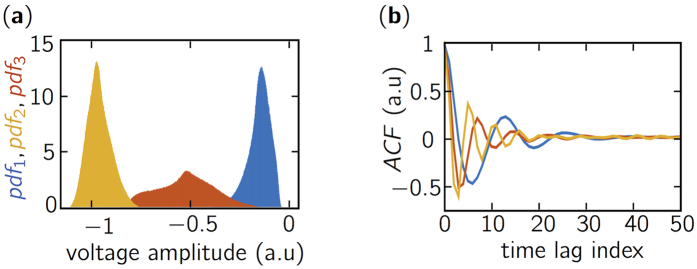
Figure 2.
(a) Estimation of probability density functions (pdf1,2,3) of the optical chaos detected by the photodiode for J1 = 1.19Jth, η1 = 5%, J2 = 1.83Jth, η2 = 12% and J3 = 2.59Jth, η3 = 20%, respectively. They are represented by blue, yellow, and red solid lines. (b) Normalized autocorrelation function close to the zero time lag for identical experimental conditions and choice of representation.

