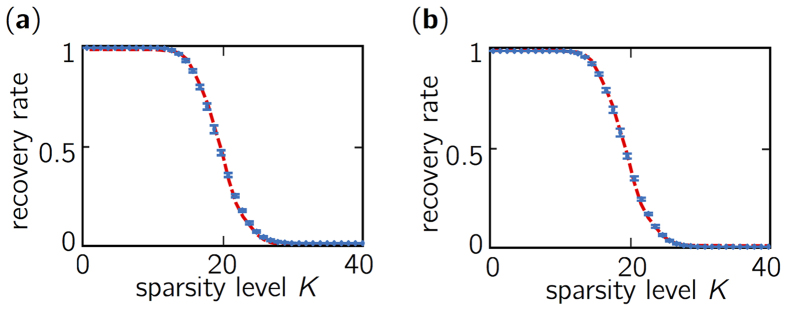
Figure 5.
Recovery rate curves for the BP problem obtained (a) for multiple feedback strengths (controlled by the polarizer angle) η ≈ 0.05, 0.6, 2.5, 5, 8.5, 12, 20 in percent of the light fed back at the facet of the laser diode, pumping current J2 and sub-sampling rate d = 50; (b) for various sub-sampling factors d = 1, 2, 5, 10, 25, 50 and for other parameters (J2, η2). The error bars (in blue) correspond to the range of recovery rates with chaotic sensing matrices. The reference curve obtained with Gaussian random variable is in dashed red.

