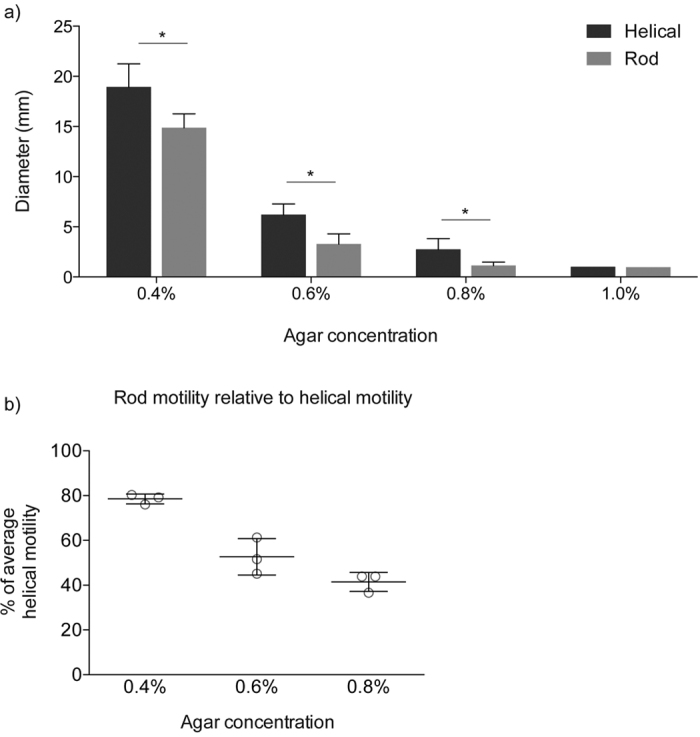
Figure 6. Motility of helical and rod WT C. jejuni M1 isolates.

(a) Average motility of helical and rod WT C. jejuni M1 isolates in 0.4%, 0.6%, 0.8% and 1.0% (w/v) select agar. Motility for all isolates decreased with increasing agar concentration until isolates were effectively non-motile through 1.0% agar (all isolates measured 1 mm diameter, roughly equivalent to the original pipette stab). Statistical differences at each agar concentration were determined using a Mann-Whitney test (*p < 0.0001). Data shown is mean and SD (n = 15). (b) Relative motility of rod isolates compared to the average motility of helical isolates decreases with increasing agar concentrations. Data shown is mean and SD (n = 3). All helical (H2, H3, H4) and rod (R2, R3, R4) isolates were also analysed by genome sequencing.
