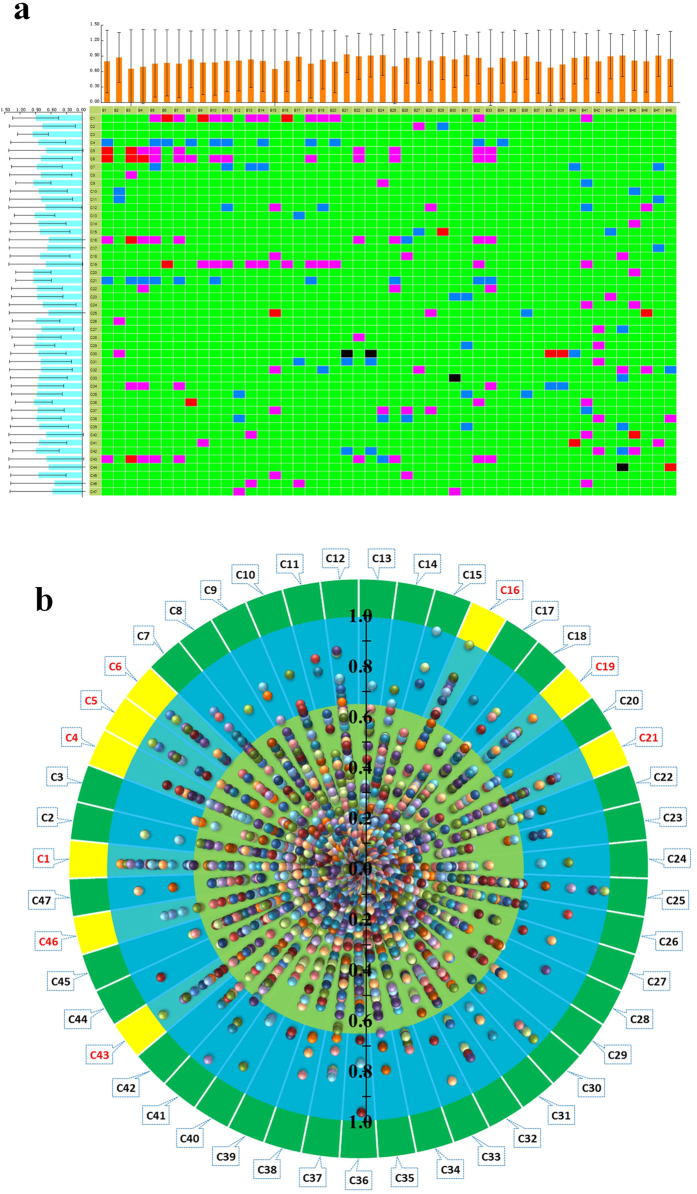
Figure 4. The heat-maps and scatter diagrams of correlation between marker metabolites and serum constituents in AS1350.
In the heat-maps:  , highly positively correlated;
  , highly negatively correlated;
  , highly positively correlated;
  , highly negatively correlated;
  , low correlation; B1 to B48 were marker metabolites (listed in Table S1); C1 to C47 were chemical components (listed in Table S2). The scatter diagram was derived from the absolute value of correlation from heat-maps, and the yellow part met the criteria: 0.65 < |r| < 1.

