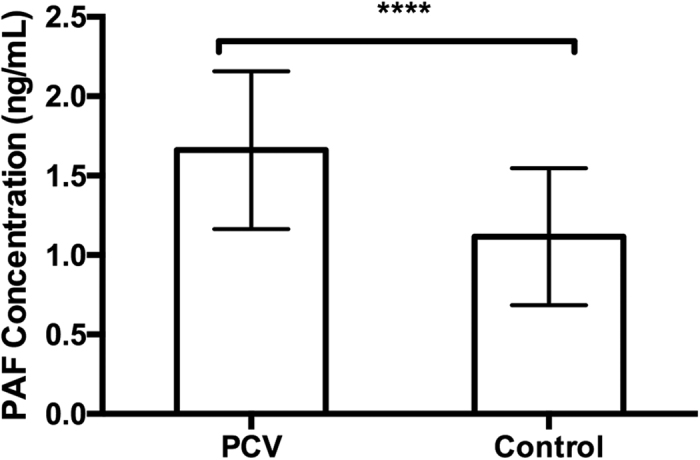
Figure 4. The levels of key indicator PAF determined by ELISA.

The difference of PAF levels between PCV patients (n = 65) and controls (n = 63) was assessed using unpaired Student’s t-tests. Two replicates were used. The error bars represent the S.D. of the mean. ****p ≤ 0.0001, compared with controls.
