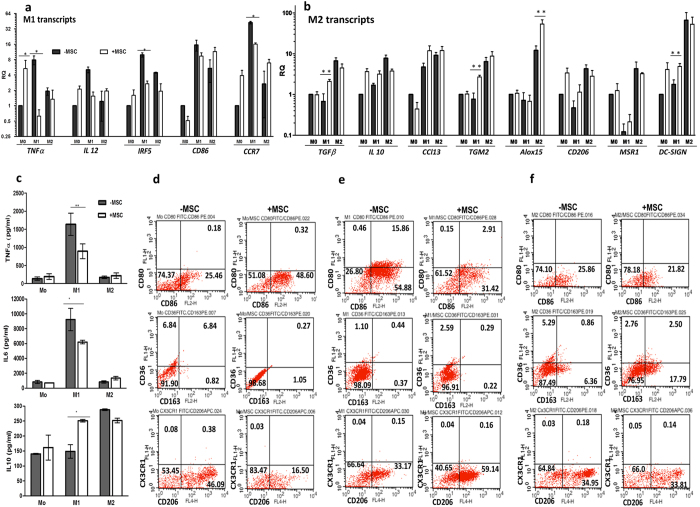
Figure 4. MSCs modulate human primary macrophage differentiation and activation states.
(a,b) Fold increase in prototypic mRNA transcripts associated with inflammatory macrophages, M1 (a) and alternatively activated macrophages, M2 (b) upon co-cultures of naïve macrophages (Mo), M1 polarized (M1) or M2 polarized macrophages (M2) with MSCs. RQ was obtained after normalizing with mRNA levels in naïve primary macrophages (n = 3, Mean ± SEM). (c) Cytokine levels of TNFα, IL6 and IL10 in supernatants of naïve macrophages (Mo), M1 and M2 macrophages with (white bars) or without (black bars) MSC co-culture (n = 3). (d,e,f) Representative flow cytometry assessment of CD80/CD86, CD36/CD163 and CX3CR1/CD206 expressing cell populations in naïve Mo (d), M1 polarized (e) and M2 polarized macrophages (f) with (+MSC) or without MSC (−MSC) co-culture. Values in each quadrant of the dot plots depict mean % cells in each population (either double positive, single positive or double negative for the combination of cell surface antigens analyzed).

