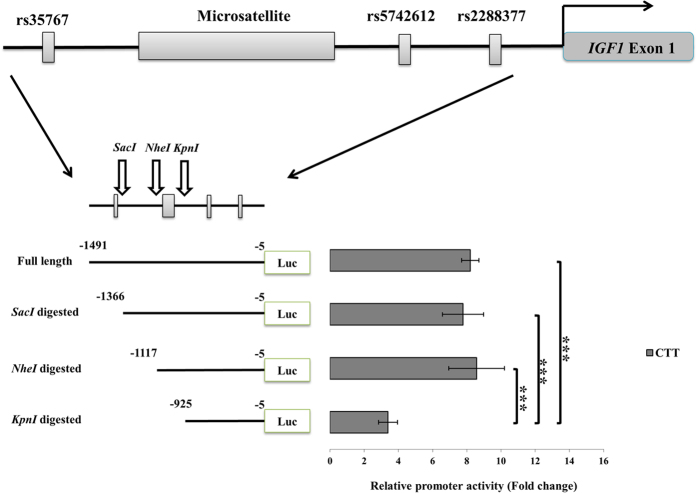
Figure 1. Effect of serial 5′ deletion of IGF1 promoter on transcriptional activity.
We compared the luciferase activity of IGF1 promoter fragments with different lengths. A schematic figure of IGF1 promoter fragment is shown at the top. Relative positions of the tagging genetic variants and restriction sites are indicated by rectangles and arrows, respectively. The full length and digested fragments cloned into the 5′-end of luciferase gene of pGL4.10 vector are represented by lines below the schematic figure of IGF1 promoter fragment. The number on the left of the lines indicates the start site relative to the translation start site (TSS) of IGF1, while the number on the right indicates the end site relative to TSS. The relative promoter activity is shown as fold change compared to an empty pGL4.10 vector. Length of bar indicates the mean, and error bars indicate the standard deviation of four independent experiments, each of which consisted of four replicates. Data were analyzed by one-way ANOVA (three or more groups), followed by Tukey’s test as a post hoc test (***p < 0.005 by post hoc test).

