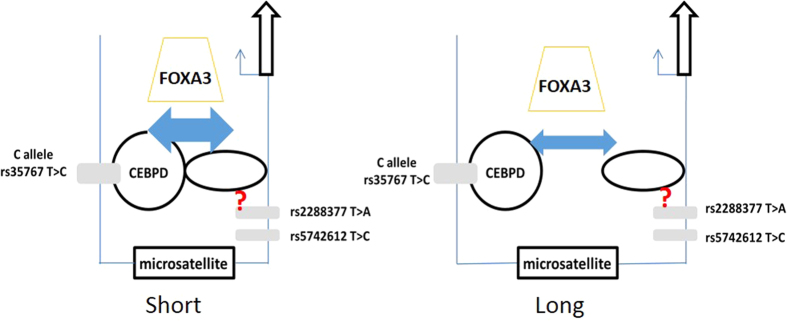
Figure 6. Putative model of the regulation of IGF1 promoter activity by the microsatellite and SNPs.
The arrow indicates the transcription start site of IGF1. Genetic variants in this study are depicted by rectangles. Transcription factor C/EBPD complex is indicated by circles. When the microsatellite length is short, the interaction between transcriptional complexes across the STR may be stronger than the case when microsatellite length is long. C/EBPD complex and FOXA3 may be involved in this interaction. The SNP rs35767 accounts for most of the transactivation property in the segment upstream of the microsatellite, while the exact functional location downstream of STR is not certain29,33.

