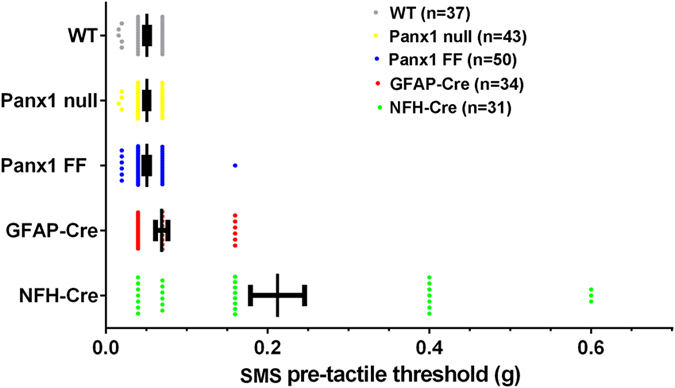
Figure 5. Comparison of basal SMS tactile thresholds in all the genotypes studied here.

Tactile sensitivity was assessed before injection of saline or CFA using von Frey filaments to determine baseline tactile sensitivity. Each point represents SMS tactile threshold obtained for each mouse measured with von Frey filaments before injection of either saline or CFA, and the range bars represent mean ± SE values of SMS tactile threshold obtained for each genotype. Note that mice with NFH-Cre targeted deletion show higher mean and a wider range of variability in tactile threshold values. WT: wild type, Panx1 null, Panx1 FF: Panx1fl/fl, GFAP-Cre: GFAP-Cre:Panx1fl/fl, NFH: NFH-Cre:Panx1fl/fl. n = number of animals.
