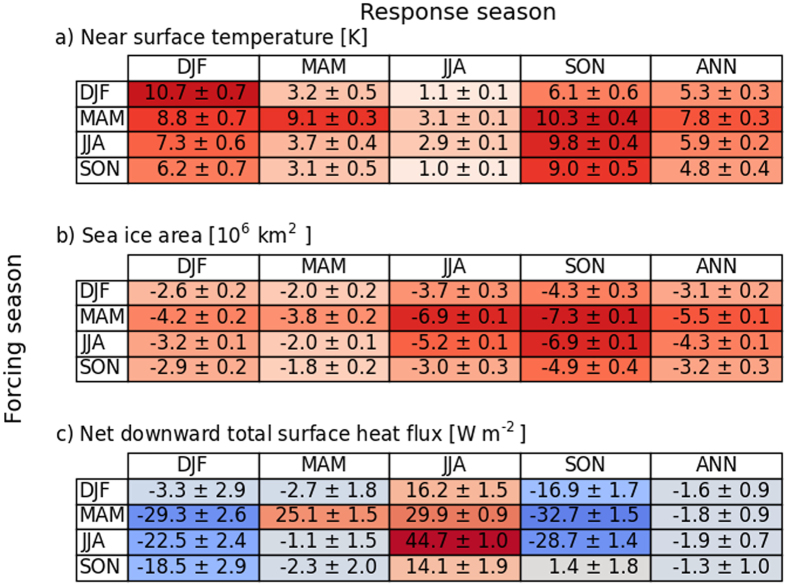
Figure 2. Simulated seasonal and annual response resulting from a surface radiative forcing in various seasons (see Methods).
Surface air temperature (in K, upper panel), Sea ice area (in 106 km2, middle panel), Net downward total surface heat flux (in W m−2, bottom panel), which is the total of the net shortwave and longwave radiative fluxes and the sensible and latent heat fluxes. Note that the 30 W m−2 additional downward forcing (see Methods) is included in the response value for the forcing season (as an example, the 44.7 W m−2 JJA response for JJA forcing includes the 30 W m−2 forcing). ANN represents the annual mean response. The uncertainties represent the 95% cadditional downward forcing (see Methods) is included in the response value for the forcing season (as an example, the 44.7 W m−2 JJA confidence interval of the mean, where seasonal (annual) means are used to evaluate the seasonal (annual) response uncertainties. Colouring indicates the magnitude and sign of the responses..

