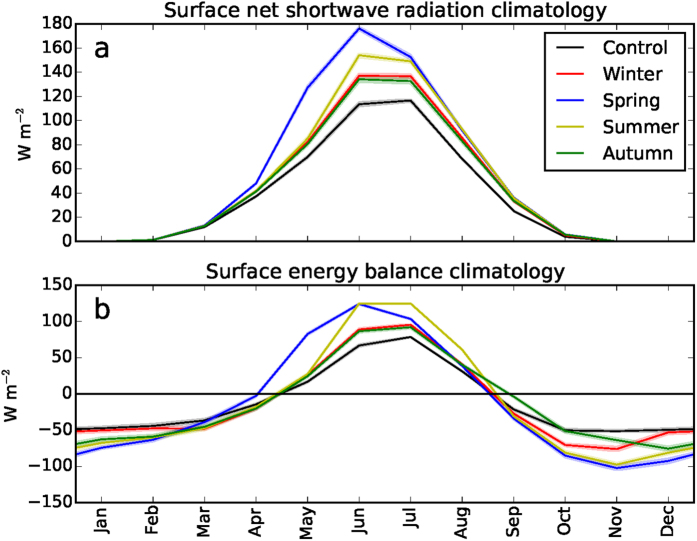
Figure 3. Simulated monthly Arctic mean surface energy budget components for each of the simulations (see Methods).
(a) Net shortwave radiation, (b) Net surface flux (i.e. radiative fluxes plus turbulent fluxes). Downward fluxes are defined positive. The legend shows the forcing season. The uncertainty band represents the 95% confidence interval of the mean.

